|
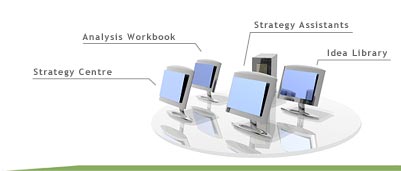
Components : Strategy
Portal : Analysis Workbook
Analysis workbook provides a powerful suite of enterprise reporting
tools in both graphic and spreadsheet formats. View your enterprise
at any level and get complex reporting and what-if analysis capabilities
right out of the box.
Create complex graphic reports using the report generator wizard,
import your current excel spreadsheets, and begin viewing your strategic
and operational reports based on actuals from the enterprise model.
Best of all, you can achieve this kind of scalable reporting without
a programmer or a large maintenance team.
| |
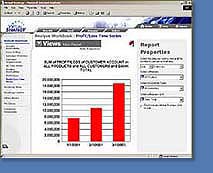
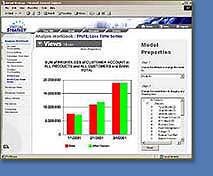
Main View
Create reports right out of the
box using our simple wizards. Then begin to analyze your enterprise,
drilling down to the lowest levels of the model using dynamic
drop down menus.
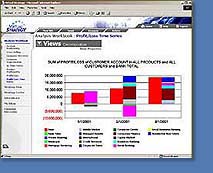
Decomposition View
Break down your data to trace trends
and assess performance using our decomposition tools. Compare
different sections of your business and produce a breakdown
view of operations.
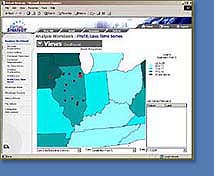
GeoReports
Plot sales, business unit performance,
supply lines and more using this geographic reporting tool.
Use overlays with custom metrics such as income levels, traffic
patterns, etc. to optimize operations and assess performance.
Model View
Perform what-if analysis inside
your reporting tools with model view. Using this drag and
drop interface, manipulate your personal view of the enterprise
model to simulate customer segmentation, product restructuring,
and business unit alignment and see the results instantly
using your actual data.
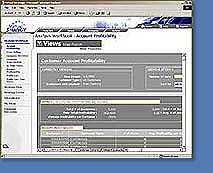
Scorecard Reports
Create custom reports using fully
excel compatible report templates. Import and link your current
spreadsheets to the model for more dynamic reporting, or create
new ones using the included wizards and scorecard designer.
Apply custom business logic using spreadsheet formulas instead
of complex programming.
|
| |
|
 |
|
|

